Every cycle there is a new viral price prediction model for Bitcoin. From elegant power laws to rainbow-coloured memes, each cycle spawns a new framework claiming to figure out how to value an asset that doesn’t fit into a neat little box. Some models last a few halvings; others don’t survive longer than the current narrative du année.
So for today’s newsletter, here are some post and pre-mortems on six of the more popular projections: What they got right, how they broke, and why none should be treated as gospel.
Stock-to-Flow: The scarcity story that stalled
PlanB’s Stock-to-Flow appropriated a gold industry valuation metric for valuing bitcoin: price rises with scarcity, measured by outstanding stock divided by new issuance.
The Stock-to-Flow curve fit Bitcoin’s first decade so well that by late 2020, $100,000 looked pre-ordained. Instead, BTC stalled just under $70k and fell 80%+ below the model path during the 2022 downcycle proving S2F critics like Nic Carter right.

Despite the deviation, PlanB released S2F-cross-asset and later S2F-multiples, widening the expected range to $500,000–$1,000,000 by 2025. Those revisions kept the narrative alive but also underscored the model’s weaknesses such as demand-side shocks and the idea that “halvings are priced in.”
Metcalfe’s Law: Users and price
Timothy Peterson showed that Bitcoin’s market cap often tracks the square of daily active addresses. This is an intuitive extension of Bob Metcalfe’s 1980s theory for valuing networks, which stipulates that the value of a network is equal to the square of its active users.
Academic follow-ups to Metcalfe’s Law added Lightning nodes, hashrate, and even GDP per capita. But this valuation assumes each connection has equal weight.
Peterson continues to tweak the model, but the original chart has since deviated significantly to the upside as on-chain Bitcoin usage lags behind price.
Bitcoin Power Law
Eyeball any long term BTC chart and you’ll notice the candles trace a widening diagonal channel on logarithmic axes. The leading champion of the so-called Power Law for bitcoin, Giovanni Santostasi, has been proliferating the model heavily over the past couple years. Notable trader Peter Brandt and the Bitbo Power-Law chart formalised that intuition: price stays within upper/lower bounds of the Power Law bands. As of May 2025, the model’s mid-line implies ~$200,000 by Q4 2025 which seems entirely plausible.
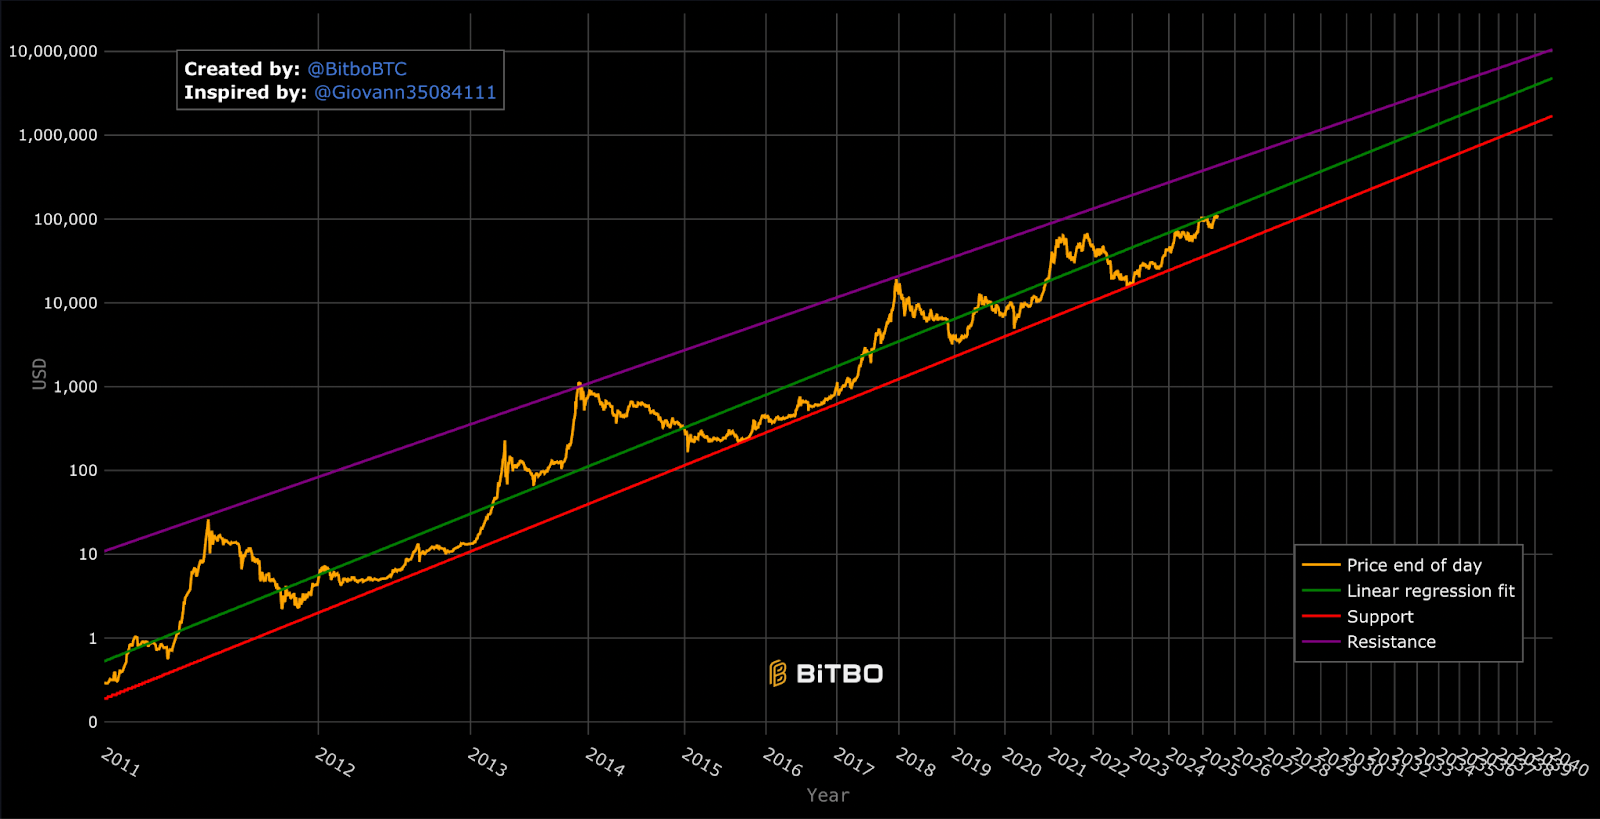
The catch? Power laws are descriptive, not causal. They survive until a structural shift, say a Black Swan event (violent to downside) or hyperbitcoinization (violent to the upside). Also, the current Power Law corridor is so wide as to risk not being very useful. For example, in 2030 the upper bound is $1.5 million and the lower bound $175,000. That seems like a pretty wide net to cast.
Institutional Structured Bid: The next model meta?
I can sense a new narrative forming that hasn’t yet been formalized. As we enter a period where institutions increasingly allocate treasuries to BTC, we may see the rise of the “Institutional Structured Bid.” You can eyeball the idea here:

Commentator Plan C predicts that Bitcoin’s future drawdowns will feel like “water torture” with drawn out sideways chop instead of the 60% – 80% crashes of 2013-present. The logic: spot-ETF creations lock supply, corporate balance-sheets refuse to panic-sell, and derivatives markets let whales hedge without dumping. For portfolio strategy that means smaller position sizing no longer buys safety – patience does.
All models will break, it’s simply a matter of time. As S2F inventor PlanB says: “All models are wrong, but some are useful”