
Where does Bitcoin peak this cycle? Prior cycles – or rather, analytic metric trends from prior cycles – might help us divine an answer.
The last several bitcoin tops had a consistent pattern: multiple, independent indicators all flashing overheated conditions.
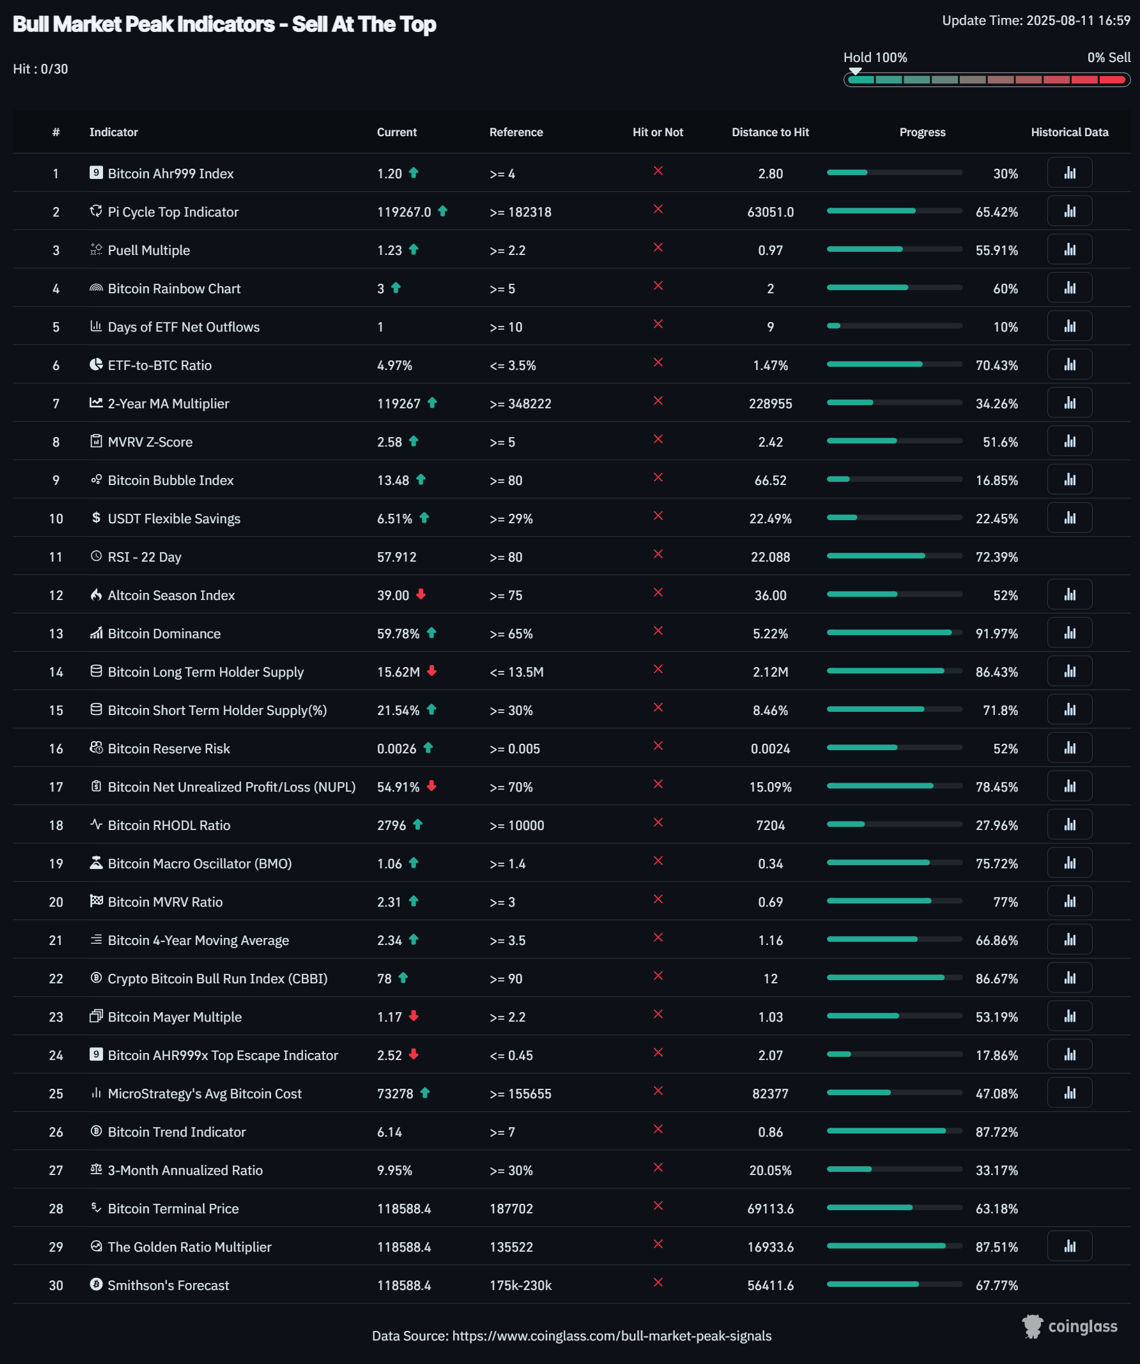
Of the 30 popular indicators, none of them are flashing “sell.” In fact, most aren’t even close to signaling the top.
These 30 bitcoin price signals are all green
CoinGlass’s Bull Market Peak Indicators dashboard tracks 30 different metrics that have historically called Bitcoin tops. Right now, that dashboard sends a very clear message: despite Bitcoin’s strong run this year, none of the key indicators are at their historical sell levels.
In a true blow-off top scenario, you’d expect to see many, if not most, of these indicators in the red zone. For example, in April 2021, the Pi Cycle Top Indicator, Puell Multiple, MVRV Z-Score, and Reserve Risk all crossed their thresholds within days of each other.
At the time of writing the dashboard reads “Hold 100%, Sell 0%” meaning zero out of the 30 indicators are flashing “sell”.

Let’s walk through a few of the more salient metrics.
Pie Cycle Top: The metric that nailed the last three bitcoin cycles
Current progress: ~63% to historical top level.
The Pi Cycle Top Indicator has a cult following in Bitcoin circles because of how cleanly it has called previous market peaks. It’s based on the relationship between the 111-day moving average and double the 350-day moving average. When the shorter-term average crosses above the long-term one, it has often coincided with major cycle tops.
Right now, the two lines are slowly converging. We’re well over halfway there by percentage terms but still a fair distance from the kind of compression that marks final-stage euphoria.

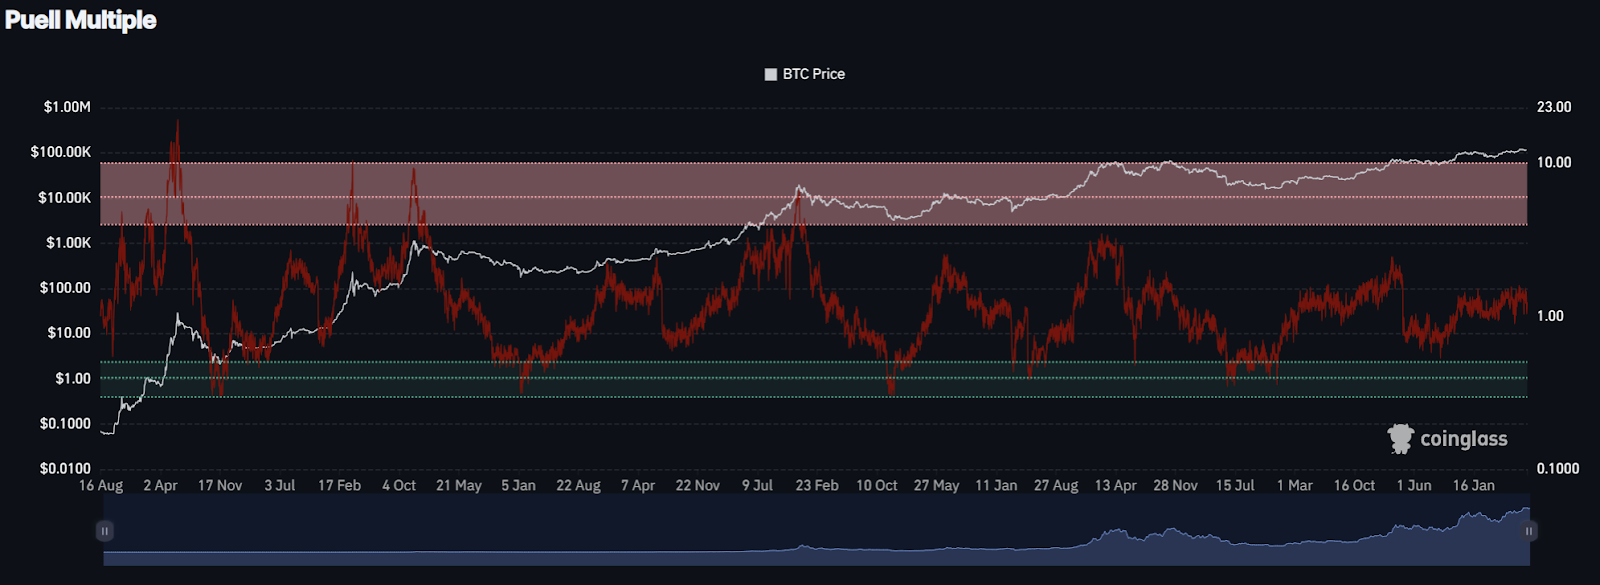
Puell Multiple: Follow the miners
Current progress: ~55%
At 1.23, the Puell Multiple, which divides daily miner revenue by its 365-day moving average, is telling us miners aren’t even close to peak revenue territory.
When miners start making at least 4x their yearly average,this often indicates unsustainable euphoria. Conversely, at the cycle bottom when bitcoin is in the dumps, bitcoin miners may become compulsory sellers when they need to cover mining operating costs.
The current Puell reading has recovered from the depths of the bear market, but it’s still well shy of historical tops. This suggests that miners aren’t in the super profitable range that historically precedes major distribution events. Mining economics have evolved recently and miners demonstrated they can stave off bear markets by leveraging capital markets so after the last halving this indicator may also need recalibration.
Reserve Risk: Long-term bitcoin holder confidence
Current progress: ~52%.
This indicator looks at the ratio between the current price and long-term holder conviction, as measured by “HODL Bank,” a cumulative metric of how long coins have been held without moving. Low risk means holders have strong conviction relative to price; high risk means conviction is low compared to the market value.
Currently it looks like holders still have substantial conviction. Near the top of a cycle, Reserve Risk spikes as long-term holders start to sell into strength.

Reality check
It’s tempting to take these readings and conclude that the bull run has a long way to go. Yes, major tops experienced a convergence of many signals and we’re nowhere near that point today, but it’s also worth noting that:
- Indicators are backward-looking. They’re based on conditions that existed in past cycles. The presence of U.S.-listed spot ETFs, changes in miner behavior, and new global demand patterns could alter how and when these signals indicate useful information. For example, a lot of these indicators look at on-chain activity. As investors increasingly adopt bitcoin through ETFs and treasury companies, the on-chain activity becomes less useful.
- Exogenous events can override market structure. A major macro shock (e.g. geopolitical crises, regulatory crackdown, recession, etc) can halt a rally well before the dashboard starts lighting up.
- Mid-cycle corrections still happen. Even during the historical runs, bitcoin saw multiple 30% pullbacks before topping.
Cycles rhyme but they don’t repeat. If we knew the exact playbook, we’d all be retired on an island somewhere. But we can at least apply historical heuristics to the current cycle, and by my estimation, it looks like we go higher from here!
Header image by Nicole Avagliano via Unsplash


